
By DONNA BALANCIA
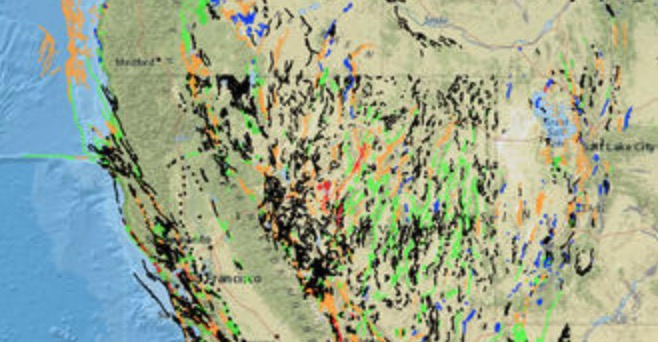
The US Geological Survey released earthquake maps that more accurately forecast seismic shaking across the U.S. including in the LA basin and in Ventura County areas.
Since the Ridgecrest earthquakes rocked Southern California last July 4 and 5, seismic shaking has taken center stage. The newly released information is a result of almost six years of research as the last USGS map was issued in 2014. The new maps indicate a recalculation in ground motion estimates in some parts of California. Pasadena scientists said the areas not near the LA Basin — like Pasadena — remain largely unchanged since 2014.
The maps show areas where the basin regions in California are miles deep. The basins over the years have collected sediment that flows down from higher elevations, and these filled pockets of sediment don’t move the same way solid rock does.
Pasadena is in a unique situation, where it sits between the mountains and not close to the LA basin where sediment collects. Long Beach areas and Ventura areas are impacted.
The New Data Maps Probability
The new maps are almost like a scientific data “retrofit” as experts recalculate probability.
But retrofit and building codes will be reflecting the new information. Many cities have implemented new building codes already.
It is the first USGS seismic report since 2014. In some areas of Long Beach and Ventura increases in ground motion could be up to 50 percent higher. Last May, Pasadena passed Ordinance 7345 a retrofit law that was initiated following LA’s passage of stringent seismic retrofit regulations in 2015.
The information and new maps converge to help people examine probability and risk and is not for predicting actual events of earthquake episodes or their strength.
The basin can be deep as several miles and in the LA area there is sediment shed off Santa Monica and San Gabriel Valleys, shed into basins. The sediment is different than the hard rock underneath. Basins filled with sediment deposit play a role in slow waves.
“We worry about taller buildings in the basins,” said Mark Petersen US research geophysicist with the USGS. “The fact that they’re so deep is what we worry about. The update helps us to understand better, in more detail for different types of levels,” Petersen said.
Petersen said people have collected a lot of information in the LA basin area. Partially because they wanted to patrol for petroleum, he said.
“The positive thing If we have a big earthquake we can model what the subsurface looks like,” he said. “It’s like, you don’t know what’s inside but you can have a catscan and they have different sources that use magnetic sources that go through you and they can image what’s inside of you. That’s exactly analogous to what these guys do. They have sources they put off at the surface and then measuring how those waves travel throught he ground. Then we know what it looks like beneath our feet.”
Petersen said the new data about the subsurface that has been collected is used to simulate ground motion using computers that can be measured. The people who are doing the work are scientists with industry, academia and government agencies and there’s a reason the maps are redone every six years.
“It’s very expensive to image the subsurface,” Petersen said. “It doesn’t happen everywhere but we have a lot of information about the LA basin.”
